Congratulations, you've hit your due date! Snap a photo!
You probably know this, but the odds are you won't have your baby today. In fact very few women actually have their babies on their due dates.
Your due date is special, however, because it's in the center of a bunch of days where you're most likely to give birth. While it's impossible to pinpoint a specific date when you'll go into labor, we know about when it is.
So don't think of your due date as a cliff you fall off of, tumbling into the unknown future if your baby doesn't show up. It's more like the top of a hill. You're riding the top of this curve for several days, and odds are good you won't be pregnant much longer.
This page breaks down the statistics for someone's who's still pregnant at 40 weeks. Out of 15762 survey responses, 8234 (52.2%) of the moms were still pregnant at this time. So in case you're wondering, yes, it's typical to still be pregnant on this day. The majority of women actually make it this far.
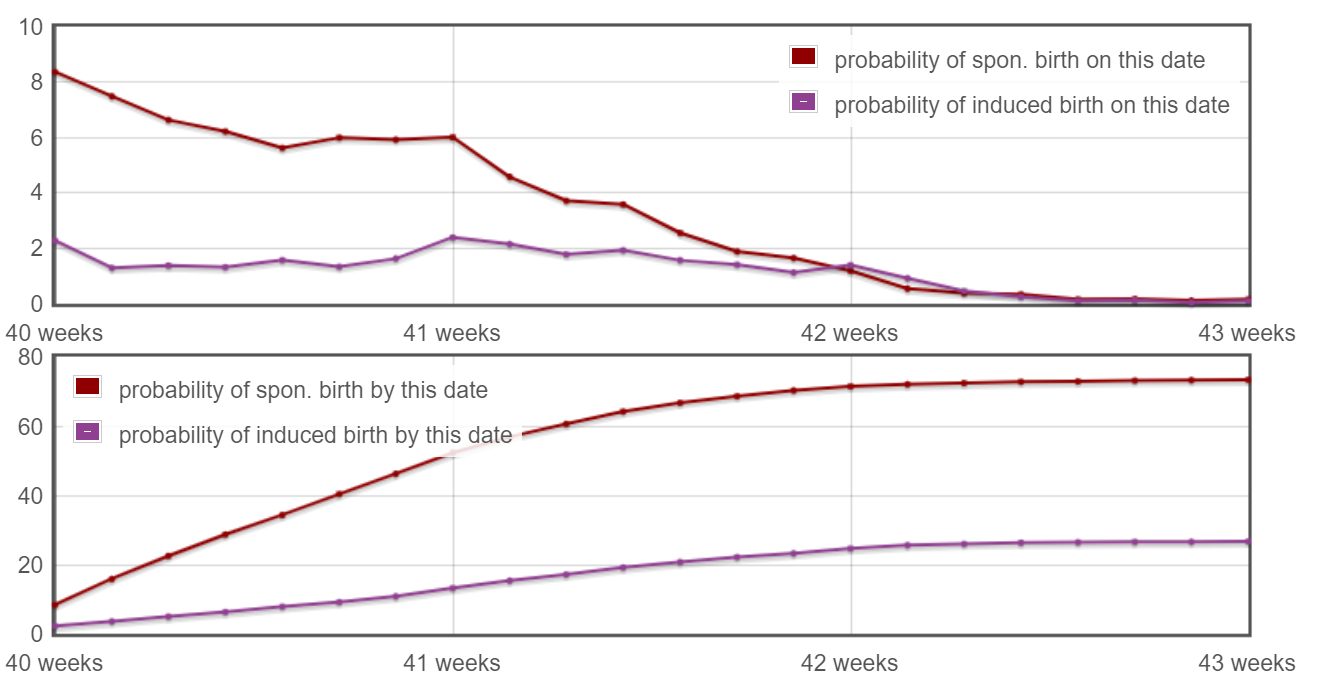
Babies born after 40 weeks, by day
What are my probability that the baby will be born soon?
Out of all the babies who hadn't been born yet at 40 weeks:
- 28.71% of babies were born spontaneously within the next 3 days (on or before 40W,3D)
- 34.33% of babies were born spontaneously within the next 4 days (on or before 40W,4D)
- 46.25% of babies were born spontaneously within the next 6 days (on or before 40W,6D)
- 56.84% of babies were born spontaneously within the next 8 days (on or before 41W,1D)
- 68.61% of babies were born spontaneously within the next 12 days (on or before 41W,5D)
- 73.34% of babies were born spontaneously within the next 21 days (on or before 43W,0D)
- 26.66% of babies were induced.
Data Table
| Day | Spon. Births by this date | Inductions by this date | Total |
|---|---|---|---|
| 40W,0D | 8.37% | 2.28% | 10.65% |
| 40W,1D | 15.86% | 3.58% | 19.44% |
| 40W,2D | 22.49% | 4.97% | 27.46% |
| 40W,3D | 28.71% | 6.29% | 35% |
| 40W,4D | 34.33% | 7.87% | 42.2% |
| 40W,5D | 40.32% | 9.21% | 49.53% |
| 40W,6D | 46.25% | 10.83% | 57.08% |
| 41W,0D | 52.26% | 13.24% | 65.5% |
| 41W,1D | 56.84% | 15.4% | 72.24% |
| 41W,2D | 60.55% | 17.18% | 77.73% |
| 41W,3D | 64.15% | 19.13% | 83.28% |
| 41W,4D | 66.71% | 20.69% | 87.4% |
| 41W,5D | 68.61% | 22.1% | 90.71% |
| 41W,6D | 70.26% | 23.23% | 93.49% |
| 42W,0D | 71.45% | 24.63% | 96.08% |
| 42W,1D | 71.99% | 25.55% | 97.54% |
| 42W,2D | 72.38% | 26.01% | 98.39% |
| 42W,3D | 72.72% | 26.27% | 98.99% |
| 42W,4D | 72.88% | 26.38% | 99.26% |
| 42W,5D | 73.06% | 26.51% | 99.57% |
| 42W,6D | 73.18% | 26.56% | 99.74% |
| 43W,0D | 73.34% | 26.66% | 100% |
Tags:
due date statistics

