
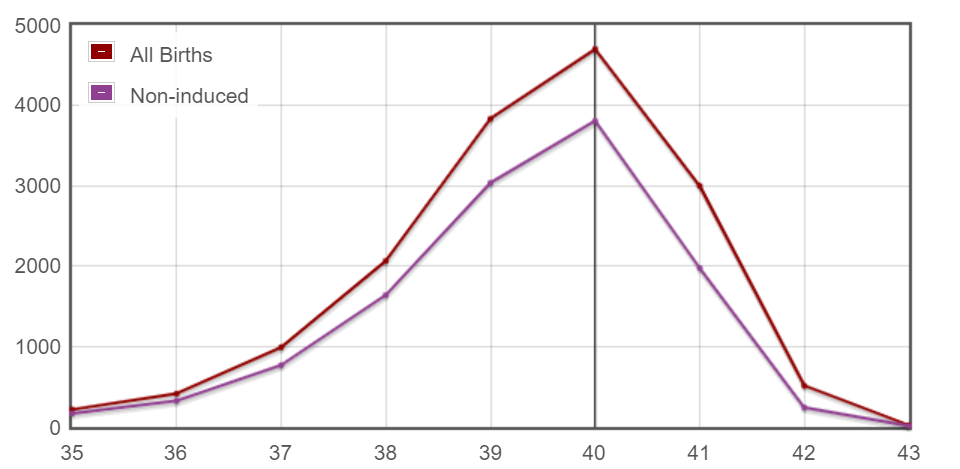
This graph groups the births by weeks. For instance, "week 40" means days 280-286.
The "running total %" basically tells you how many babies have
been born by the end of the week. For example, 37.8% of women went into labor spontaneously before
they hit week 40.
Summary
Excluding inductions, here are the percentages for each week:- Percentage of babies born at 35 weeks: 1.4%
- Percentage of babies born at 36 weeks: 2.7%
- Percentage of babies born at 37 weeks: 6.4%
- Percentage of babies born at 38 weeks: 13.7%
- Percentage of babies born at 39 weeks: 25.3%
- Percentage of babies born at 40 weeks: 31.8%
- Percentage of babies born at 41 weeks: 16.5%
- Percentage of babies born at 42 weeks: 2%
- Percentage of babies born at 43 weeks: 0.1%
Data Table
Total births: 15762| Week | All births | % of total | Running total % | Spontaneous | % of total | Running total % |
|---|---|---|---|---|---|---|
| 35 | 217 | 1.4 | 1.4 | 169 | 1.1 | 1.1 |
| 36 | 417 | 2.6 | 4 | 325 | 2.1 | 3.2 |
| 37 | 992 | 6.3 | 10.3 | 770 | 4.9 | 8.1 |
| 38 | 2066 | 13.1 | 23.4 | 1644 | 10.4 | 18.5 |
| 39 | 3836 | 24.3 | 47.7 | 3037 | 19.3 | 37.8 |
| 40 | 4700 | 29.8 | 77.5 | 3808 | 24.2 | 62 |
| 41 | 2998 | 19 | 96.5 | 1977 | 12.5 | 74.5 |
| 42 | 515 | 3.3 | 99.8 | 241 | 1.5 | 76 |
| 43 | 21 | 0.1 | 99.9 | 13 | 0.1 | 76.1 |
Tags:
due date statistics