
I wanted to make this simple data table after many visitors posed this question: "We know that many women are induced for to avoid going postdate, doesn't this bias our data?"
Fair question. Most of the graphs I have just throw out inductions and show data based on only spontaneous labor. But what if ALL those women who were induced were actually supposed to go late, how long would the real average pregnancy last?
Is the Mittendorf-Williams rule be more accurate?
Most people who ask me if 288 days is the real average have read about the "Mittendorf Rule", also known as the "Mittendorf-Williams" rule. This is based on one 1990 Harvard study called The length of uncomplicated human gestation (Mittendorf et al). The study looked at 31 first-time moms at one private practice, and their average due date was eight days early. If you want to read it, it's here. But I have not found any other study that duplicated thier results, and I've found multiple other studies (noted on the intro page) that recommend sticking with 40 weeks (280 days), changing the average by maybe a day or two for first time moms. I separate out my survey data for first time moms here.I'll just say it: Many people also ask this question because they think the medical community has an agenda and wants to induce us "early" for convenience. I do not believe this; I like doctors. They are having babies too.
288 days is actually a huge difference and it would be VERY difficult to keep using 280 days if 288 was the truth. With the 9-10 day standard deviaitons we've found, an average of 288 would mean that on day 280, 80% of pregnant women would have to still be pregnant.
Is that even possible? On this page, I pretend that every single induction before 40 weeks would have been a spontaneous birth at 42 weeks... and I still can't get to a 288 day average. Sorry, Mittendorf-Williams rule. But so many women spontaneously go into labor in the days leading up to 40 weeks, there aren't enough inductions to make a difference.
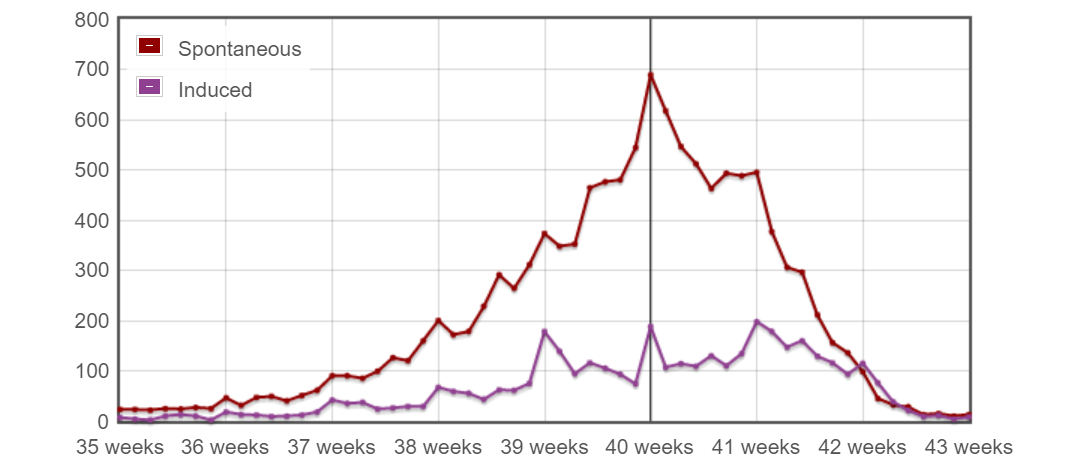
Here are the median days for the spontaneous labors (12396 total), and the shifted median if every induction (3823 total) was actually supposed to be a very late birth:
| Day | Spontaneous births on this day | Spontaneous births on or before this day | Spontaneous births after this day | Spontaneous births after this day plus all inductions |
Notes? |
|---|---|---|---|---|---|
| Before 39 W | 2940 | 9456 | 13279 | ||
| 39W,0D | 375 | 3315 | 9081 | 12904 | |
| 39W,1D | 348 | 3663 | 8733 | 12556 | |
| 39W,2D | 356 | 4019 | 8377 | 12200 | |
| 39W,3D | 466 | 4485 | 7911 | 11734 | |
| 39W,4D | 476 | 4961 | 7435 | 11258 | |
| 39W,5D | 481 | 5442 | 6954 | 10777 | |
| 39W,6D | 544 | 5986 | 6410 | 10233 | |
| 40W,0D | 1051 | 7037 | 5359 | 9182 | Median for spontaneous births in the survey (more babies were born on or before this day than are born after) |
| 40W,1D | 620 | 7657 | 4739 | 8562 | |
| 40W,2D | 548 | 8205 | 4191 | 8014 | Median if all inductions are added to the "later birth" total (more babies were spontaneously born on or before this day than all the ones born after, or induced) |
| 40W,3D | 512 | 8717 | 3679 | 7502 | |
| 40W,4D | 465 | 9182 | 3214 | 7037 | |
| 40W,5D | 493 | 9675 | 2721 | 6544 | |
| 40W,6D | 488 | 10163 | 2233 | 6056 | |
| 41W,0D | 496 | 10659 | 1737 | 5560 | |
| 41W,1D | 378 | 11037 | 1359 | 5182 | |
| 41W,2D | 306 | 11343 | 1053 | 4876 | |
| 41W,3D | 296 | 11639 | 757 | 4580 | |
| 41W,4D | 211 | 11850 | 546 | 4369 | |
| 41W,5D | 156 | 12006 | 390 | 4213 | |
| 41W,6D | 136 | 12142 | 254 | 4077 | |
| 42W,0D | 98 | 12240 | 156 | 3979 |
Conclusion: if all the induced women who took my survey had been left to stay pregnant until the very end (past 42 weeks), then the median day for birth would shift by 2 days. Not an entire week.